
日历饼图
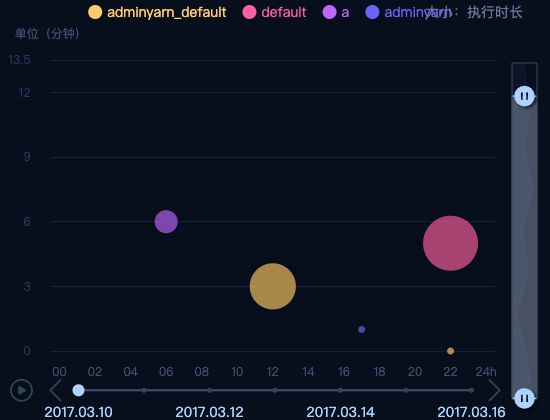
时间轴散点图动态数据_Job
visualMap.horizontal 设置水平但visualMap组件没有显示全

各学院男女占比图
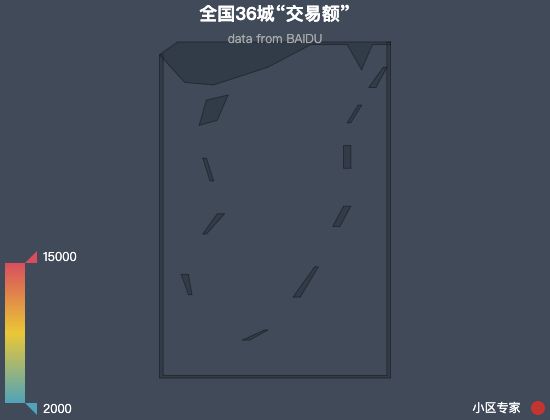
求问怎么才能让地图放大缩小?文科妹子一枚,哪位哥哥给解决下加WX
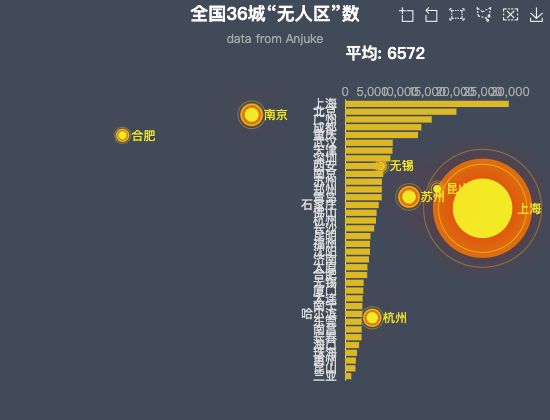
全国36城“无人区”数

全国36城无人区数量
全国36城无人区占该城市所有小区的比例
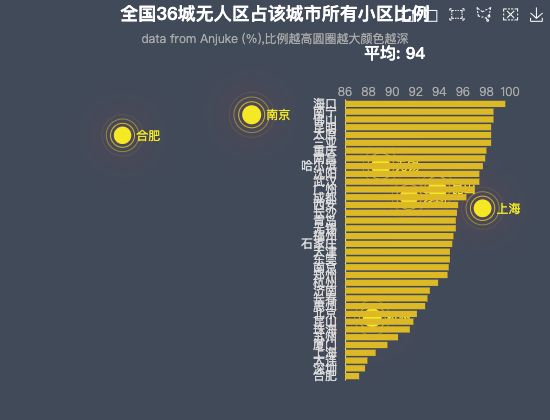
全国36城无人区占该城市所有小区比例

全国36城无人区占该城市所有小区比例
全国36城小区专家数
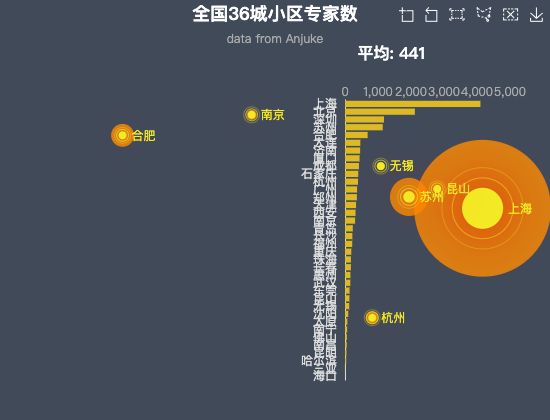
全国36城小区专家数
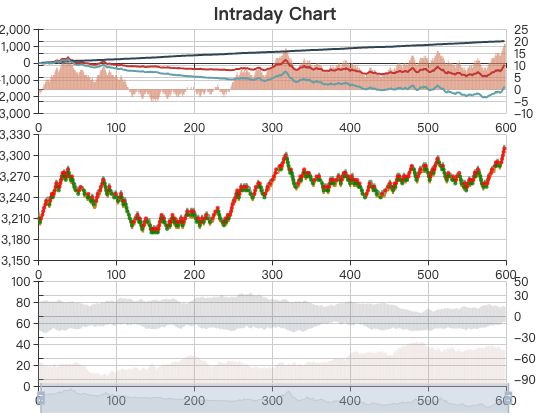
Intraday Chart
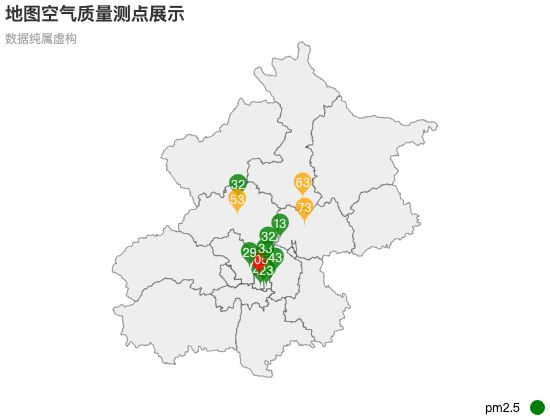
北京空气质量测点地图展示

30 days sale data
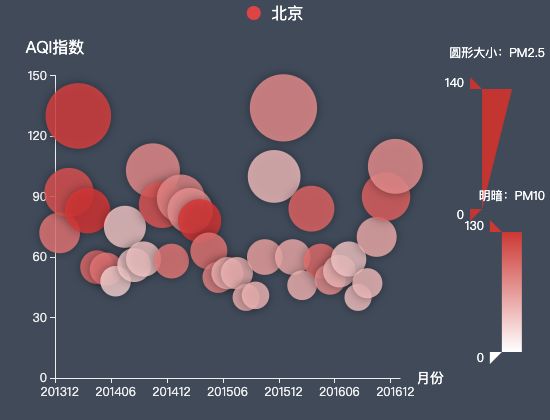
北京13至16年AQI-PM10-PM2.5按月统计
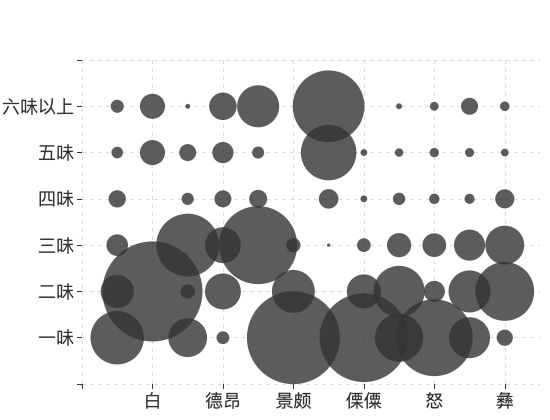
验方数据
5
3
2
1

前30 数据分布
Flow Algorithm
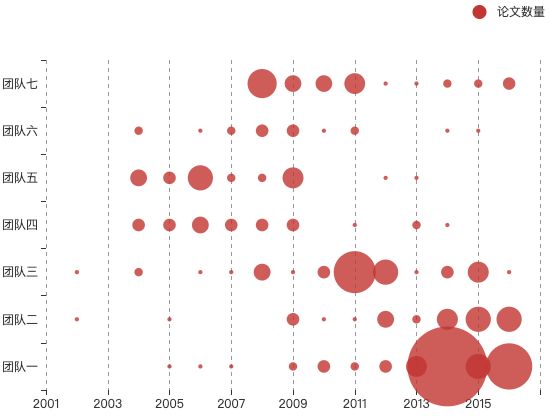
主要研究团队发表论文年度统计

logarithmic regression - 1990 and 2015 per capita life expectancy and GDP

linear regression

exponential regression - 1981 to 1998 gross domestic product GDP (trillion yuan)

polynomial regression - 18 companies net profit and main business income (million)

static clustering

Dynamic Clustering

全国主要城市空气质量 - 百度地图 我自己将代码复制出来不能展现效果
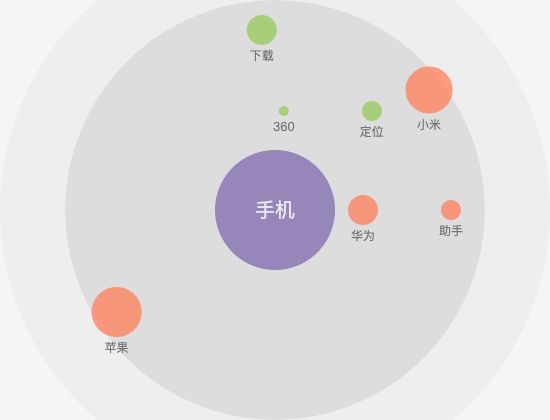
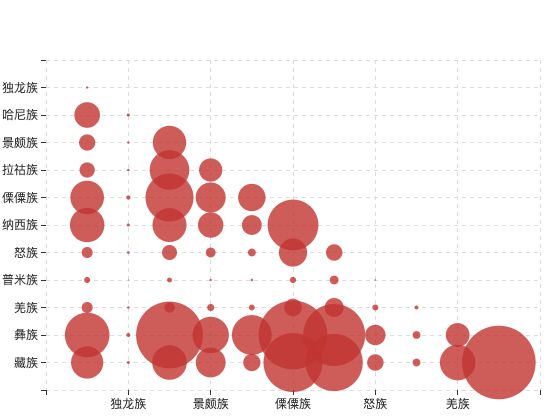
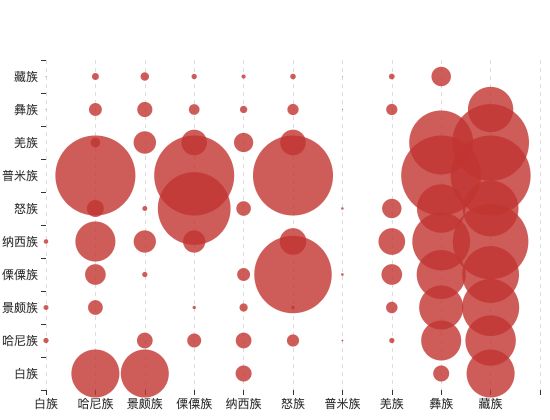
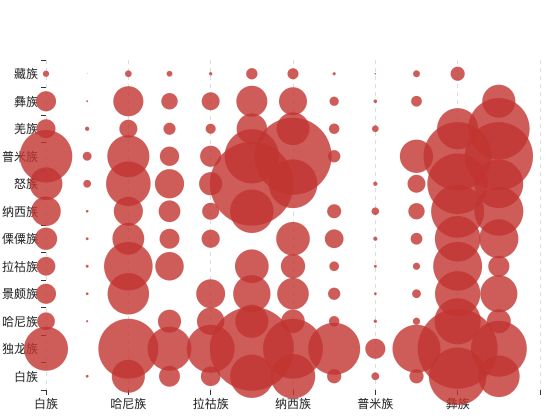
相关性图谱